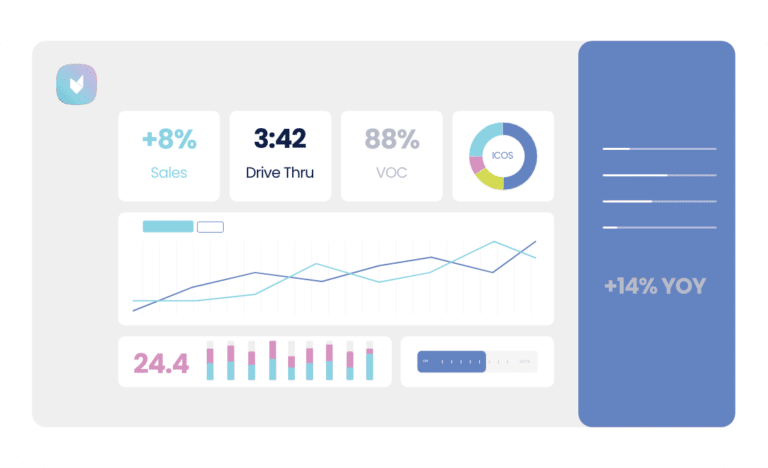
"Delaget Coach makes life easier for me and my whole operations team. It cut my meeting prep time by more than half because everything is right there on one screen. I can drill into the data and quickly get at the information I need."
Amy BoshearsVP of Operations, Wisconsin Hospitality Group 
"I like being able to see sales compared to last year for my entire area with one click. The graphs for sales and speed for dayparts show multiple stores at once, which really helps me understand if sales or speed is out of whack."
Cole MooreArea Coach, B&G Food Enterprises, Taco Bell 
"I’ve been an area coach for over 30 years and can tell you that I don’t have time to go from report to report to understand what happened at a location. I need everything in one place, and Delaget Coach provides that for me."
Monico BaughArea Coach, R&R Ventures 
"With the combined capabilities of Delaget and Envysion’s partnership, KFC franchisees will have access to powerful loss prevention tools, saving them time and helping them run more efficient operations. We saw excellent results with the pilot and are excited to roll it out to our franchisees."
Chris Caldwell Chief Information Officer, KFC U.S 
"I like the easy accessibility of metrics that are important in our day-to-day business. All of our most important metrics appear on the dashboard without having to search for them."
Ivy FigaroArea Coach, B&G Food Enterprises 
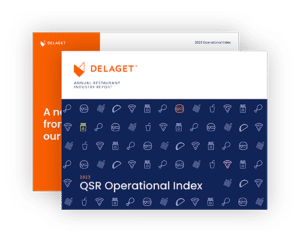
The 2022 QSR Operational Index is the only industry report of its kind, containing key metrics across the most important facets of restaurant business performance.
This year’s index is jam-packed with data all restaurant operators need to benchmark their performance.
Download the index now and receive:
Sales and costs data: Revenue, guest checks, transactions, beverage sales, food costs, labor costs, and channel sales data that compares drive-thru, counter, and other channels’ evolution from pre-pandemic to the present.
Employee and wage trends: Average wages and turnover rate mapped by state, turnover trends over three years.
Loss metrics: Key loss indicator averages and metrics by AUV, refunded transactions, cancelled transactions, and more.
Customer experience and speed insights: Meaty voice of customer and speed of service insights like average drive-thru time, and trends over four years.


