


See How You Compare!
See How You Stack Up Against The Competition!
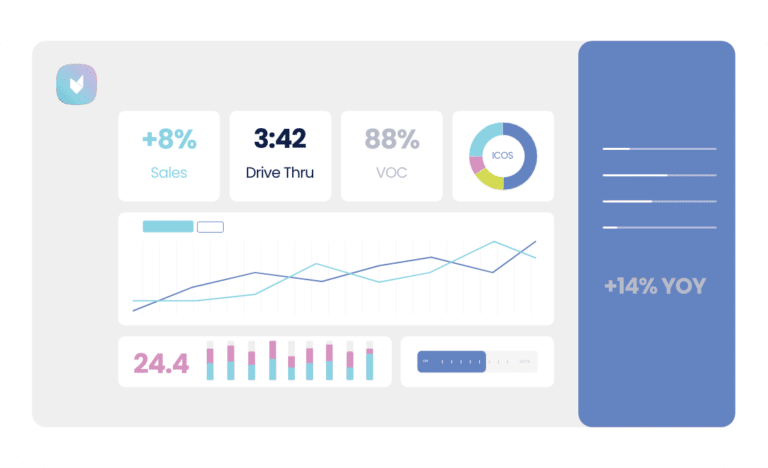
Want to see how your company is performing compared to the average operators in your space? Compare how you’re doing versus the top 10% with an easily digestible report. We’ve analyzed more than 3,000 locations in 5 key areas:- Sales YOY
- ICOS variance
- Labor hours
- Drive-thru speed with service
- Voice of customer