Menu
Login
- SOLUTIONS
-
-
FRANCHISEES
-
FRANCHISORS
PARTNER VENDORS
-
-
-
- MARKETPLACE
- RESOURCES
- ABOUT
- SCHEDULE A DEMO
-

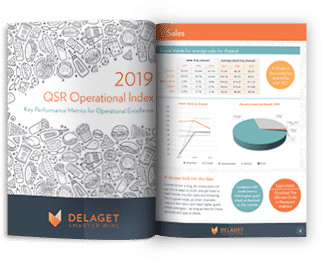
As the restaurant industry gets more and more complex, understanding how you compare against your competition has become essential for growth. With Delaget’s 2019 QSR Operational Index, you’ll see how your restaurants stack up in the most important operational metrics.
Based on data from 6,000 quick service restaurants, the Index makes it easy to identify areas of your operation that could use some TLC as well as those that deserve a round of high fives. Either way, you’ll be smarter about your business and can make more informed decisions.
Download the Index to get the scoop on how the QSR industry performed in 2019 across these critical operational metrics:
Sales
Costs
Employee trends
Fraud
Customer experience
Get the Index today, and find out where your restaurants shine and where they could use some polish.
Delaget’s blog on operational strategies to grow your business faster.
Everything You Need to Know About Hiring & Retaining Teenagers During the 2021 Labor Crisis
Nickels and Dimes: 4 QSR Operational Money-Savers You Likely Haven’t Tried Yet
QSR Loss Prevention: 4 Ways to Prevent and React to Employee Theft