


Is your QSR operation ready for configurable reporting?
Few businesses collect and analyze more data than QSRs. With just about every aspect of your operation comes data – from your POS, payroll, and scheduling systems, to back-of-house and inventory, and everything in between. In fact, according to the National Restaurant Association, the average restaurant relies on 10-19 unique technology systems (that's a lot!) On top of that, you have all of that data to process for multiple stores and in some cases, multiple brands.
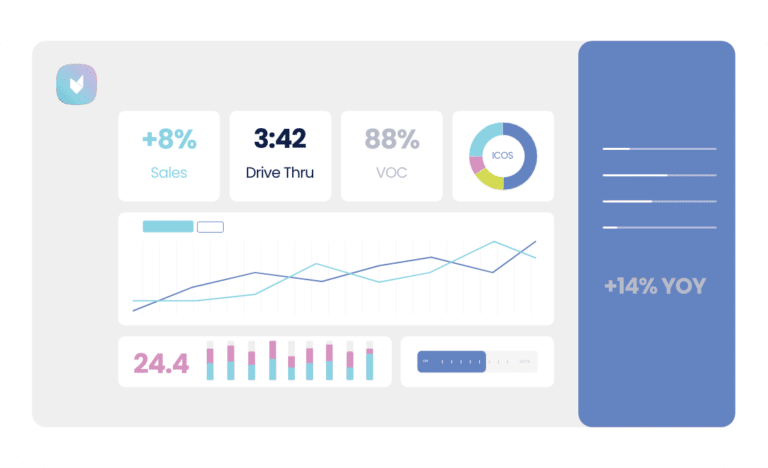
A dashboard compiles all of the data from each of your stores into a single tool. You can use a data dashboard to take a quick peek at how each of your stores is performing, or to do a deep dive into your sales or inventory numbers. There are numerous uses for data dashboards, and a bunch of fantastic money and time-saving perks to using them (like saving Area Coaches 2+ hours of work a day!)
Clearly, dashboards have many benefits, but how do you know your business has become big enough to need one? Here are some signs that your QSR is ready to upgrade to a comprehensive dashboard.
1. Too much data, no consolidation or actionable items
Sales numbers. Inventory. Wage Rates. Productivity. Hourly reporting. That's a lot of information, and that's just scratching the surface of the data your stores are collecting. Now multiply that amount of data by the number of stores you have, and then do it again if you're operating multiple brands. The volume of information available to you can be staggering, and if you don't have it all in one place, you're wasting time and energy tracking it all down.
A dashboard can take all of these pieces and put them together, so you can spend your time acting on the data instead of trying to decipher it. And even better, by putting all of the data together, you can more easily identify trends and gather insights about your stores (we'll talk more about that later).
2. Digging for old reports takes your team hours
Tell me if this sounds familiar: You want to look at your sales data from this time last year to compare year-over-year results, but you've been putting it off because digging out that old binder from last year sounds like a huge pain. Even if your data is stored electronically, hunting for historical data can be a huge time sink.
A dashboard organizes all of your historical information in one easy-to-find location, and can often show you information like year-over-year numbers automatically.
No more clicking through old files or dusting off cardboard boxes – your reports are always available when you need them. (Goodbye, spreadsheets!)
3. Crucial data is inaccessible
So you have access to all of this information about, for example, wage rates for each of your stores. Does your human resources team have the same access - and are you both seeing the same, accurate data? Can your finance team see all of the sales data? And again, are you all seeing accurate, consistent data?
Any amount of time spent forwarding reports to other people is too much. With a dashboard, it's simple to make information available to those who need it (and to keep it secured from those who don't).
Here's another question: Would your store managers benefit from a little healthy competition? Sharing basic information about each store with managers can encourage lower-performing stores to step things up, while also recognizing the figures of higher-performing stores. Dashboards make it easy to share store numbers with your management team.
4. You want to grow and achieve operational excellence
You're collecting tons of data, and every day you get more. You're glad you have it, but maybe you're not quite sure how to put it all to good use. A dashboard can help. Putting all of your data from each of your stores into one place makes it much easier to identify trends and to glean insights that you might not have made by looking at each store or report individually.
Let's use employee productivity as an example. Employee productivity can be measured in a few different ways, but the most common is probably sales per labor hour. With a dashboard, it's easy to match sales per hour with employee hours to get a quick look at sales per labor hour in each of your stores.
And if you have a smart dashboard, like Delaget Coach, you can find more in-depth trends. Working with the same employee productivity metric, you can also discover what employees you should pair together to maximize sales or minimize loss.
Keep a close eye on inventory, identify best-performing employees, rank your stores by efficiency instead of just sales – a dashboard allows you to easily see what's going on in your stores at every level.
There are many ways that a dashboard can make your life easier, from simply combining your data in one place to helping you optimize your stores. Stop spending time and energy grappling with all of your different data sources; let a dashboard do that for you, so you can focus on what matters.
Delaget Communications
Delaget is the number one resource for QSR data aggregation and understanding. Smarter Wins.